

Electrocardiogram (ECG) signal is a powerful data source to study heart function and diagnose several abnormal arrhythmias. In this article Exposit Machine Learning Engineer Artem Khodakov and MedRecord Analyst and Medical Doctor Elena Rostovtseva share how Machine Learning and deep-learning techniques can help in measuring Heart Rate Variability (HRV) and detecting Atrial Fibrillation (AF).
Importance of the HRV monitoring and AF detecting for heart patients
Heart Rate Variability
In the second half of the 20th century a significant influence of the autonomic nervous system on cardiovascular mortality, including sudden cardiac death, was recognized [10]. In other words, heart rate is an indicator of abnormalities in the autonomic nervous system, and a change in heart rate variability is the earliest predictor of many diseases.
The autonomic nervous system is the primary mechanism in control of heart rate and rhythm regulation along with other mechanisms such as pacemaker tissues. The dependency between a predisposition to lethal arrhythmias and signs of increased sympathetic activity or decreased activity of the vagus nerve is evidenced in experiments. That, in turn, affected the development of quantitative markers of autonomic nervous system activity including one of the most promising markers is Heart rate variability (HRV).
The clinical relevance of heart rate variability was first detected in 1965 by Hon and Lee [11], as they noted, that fetal distress (changes in the heart rate) preceded the changes in the dynamic range of cardiac intervals and figured out how to prevent this pathological condition. Since that, various research projects on HRV have been performed (Sayers, Ewing, Wolf, Akselrod, etc.), and many scientific works were devoted to the study of HRV.
The clinical importance of HRV became obvious in the late 1980s, when it was proved that certain HRV parameters could be strong and independent predictors of mortality after acute myocardial infarction [12]. HRV can provide additional valuable information on physiological and pathological conditions and increase risk stratification. In clinical practice, the analysis of HRV use is increasingly growing. The popularity of this technique is rising due to the high predictive significance of the results with the relative simplicity of its analysis.
Atrial Fibrillation
Atrial fibrillation (AF) is one of the most common persistent heart arrhythmias in cardiological practice. It increases risk of death, heart failure, thromboembolic complications (e.g., stroke, pulmonary embolism) and often leads to patients’ hospitalization [9]. Along with the global population aging and increased survival rates from chronic diseases, the prevalence of atrial fibrillation (AF) is growing exponentially [13]. Thus, the associated morbidity and mortality make AF a significant public health burden. The public health aspect of AF inspires the urge for researching risk factors for AF and improving the accuracy of AF prediction and management. The current technological (e.g., eHealth) and methodological (Artificial Intelligence) advances are relevant for future disease prevention and disease management.
AF prevalence estimates in the United States ranges from about 2.7 million to 6.1 million and that number is expected to rise to 12.1 million in 2030. The approximate worldwide number of individuals with Atrial Fibrillation in 2010 was 33.5 million, according to a 2013 study. That’s about 0.5 percent of the world’s population [2].
Machine Learning in AF detection and HRV analysis
Theoretical Framework
Measuring heart rate variation reveals a wide range of information about body and health even while other physiological parameters are still in their normal or accepted ranges. HRV has been scientifically proved to be one of the best measures to test the ANS (autonomic nervous system) function [1]. HRV analysis includes 2 different approaches:
- Time domain methods are based on RR-intervals measurements. Time domain includes a whole range of metrics, each having a specific interpretation of variability each. These metrics were standardized in a Task Force of ESC/NASPE report in 1996 [3].
- Frequency domain analysis which studies the power distribution in the frequency domain. It shows how much of the signal lies within a certain frequency band. High (HF) frequencies between 0.15 – 0.40 Hz are associated with Parasympathetic activity (recovery) and lower frequencies (LF) between 0.04 – 0.15 Hz are linked to both sympathetic and parasympathetic activity [4].
Data and methods
In this study, AF is detected using deep-learning technologies. Convolutional Neural Network (CNN) is deployed for ECG classification on NO (Normal rhythm) and AF. We used the “AF Classification from a Short Single Lead ECG Recording – The PhysioNet Computing in Cardiology Challenge 2017” dataset (8528 ECG samples) to train and evaluate the performance of our AF detection model [5, 6].
One of the challenges we’ve solved during this study is finding segments on an ECG (ability to annotate a signal). Detection of QRS peaks but P-waves as well as T-waves allows us to generate a detailed report about ECG, including segments longitude and amplitude anomalies. We can also analyse HRV metrics by calculating RR intervals.
QT Database has been used for annotation algorithm training [7, 6]. QT includes 105 fifteen-minute two-lead ECG recordings. We use Hidden Markov Model (HMM) for ECG annotation, which was trained on QT Database.
Study results
There are 2 formats of output for each Machine Learning model:
- Pure data (in JSON, XML or binary format) that can be used in API requests for further analysis or visualization.
- Visualized data obtained using Python plotting libraries.
Results of ECG Segmentation and HRV measuring contain an annotated signal with QRS peaks locations in time and a list of HRV parameters. Depending on output format it could be provided as a JSON object or printed and saved as a plotted annotated signal (Figure 1) and a table with parameters (Figure 2).
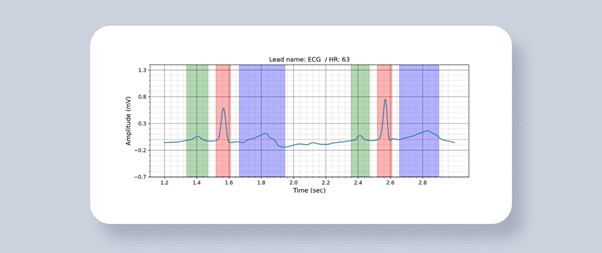
Figure 1. ECG Segmentation. Colored areas are predictions of waves and segments. Green area – P-wave, red area – QRS segment, blue area – T-wave.
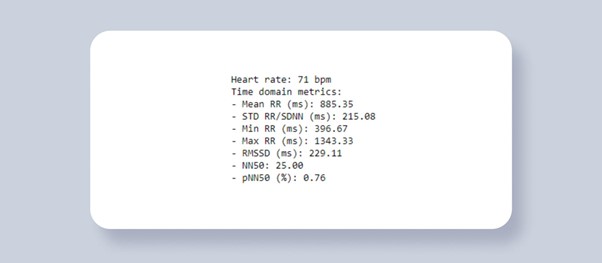
Figure 2. HRV analysis. Time domain metrics.
The results of AF model training are provided below. The model has been trained to classify input ECG data into two classes: the one that has atrial fibrillation (‘AF’ label) and the other one that doesn’t (‘NO’ label).
You can see the performance of the model at the figure below (Figure 3). The top part of the table gives you a class-level statistics of training. It includes precision (positive predictive value, PPV), recall (sensitivity), F1 score (a measure of a test’s accuracy) and support (the number of samples). We test our model on a data set that has never been used in the training process to provide reliable estimates and objective evaluation of the model’s effectiveness: F1 0.9 value means that 90% of AF ECGs have been classified correctly.
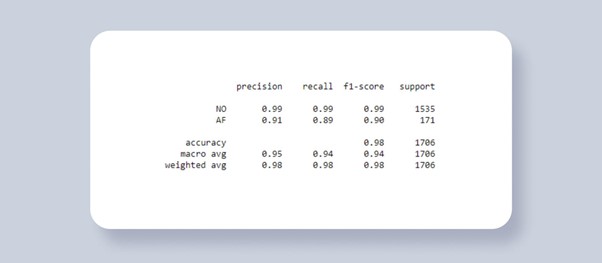
Figure 3: Atrial Fibrillation model training result generated using scikit-learn classification report.
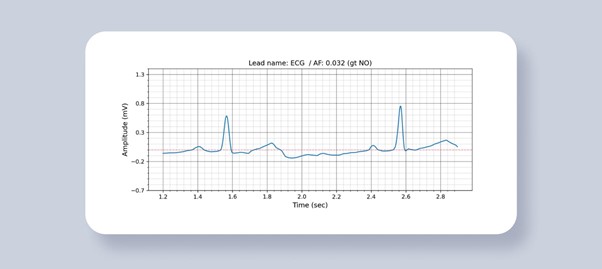
Figure 4. AF Detection result. The probability of AF and ground truth value is written in the title.
MEDrecord software represents the ECG recordings in compliance with the HL7 FHIR standards, that allows to keep the clinical ECG data value.
References
- “About ECG & HRV”. MedTach
- Jen Thomas, Gerhard Whitworth, R.N. “Atrial Fibrillation: Facts, Statistics, and You” Healthline, 16 March 2020.
- Malik, Marek. (1996). Heart rate variability: Standards of measurement, physiological interpretation, and clinical use. Circulation. 93. 1043-1065.
- Salomon Tetelepta. “Exploring Heart Rate Variability using Python” Kaggle, 6 January 2019.
- “AF Classification from a Short Single Lead ECG Recording – The PhysioNet Computing in Cardiology Challenge 2017”. PhysioNet.
- Goldberger, A., et al. “PhysioBank, PhysioToolkit, and PhysioNet: Components of a new research resource for complex physiologic signals. Circulation [Online]. 101 (23), pp. e215–e220.” (2000).
- “QT Database”. PhysioNet.
- Laguna P, Mark RG, Goldberger AL, Moody GB. A Database for Evaluation of Algorithms for Measurement of QT and Other Waveform Intervals in the ECG. Computers in Cardiology 24:673-676 (1997).
- Patel NJ, Deshmukh A, Pant S, et.al. Contemporary trends of hospitalization for atrial fibrillation in the United States, 2000 through 2010: implications for healthcare planning. Circulation. 2014 Jun;129(23):2371-9.
- Corr PB, Yamada KA, Witkowski FX. Mechanisms control-ling cardiac autonomic function and their relation to arrhyth-mogenesis. In: Fozzard HA, Haber E, Jennings RB, Katz AN,Morgan HE, eds. The Heart and Cardiovascular System. NewYork: Raven Press, 1986: 1343–1403
- Hon EH, Lee ST. Electronic evaluations of the fetal heart rate patterns preceding fetal death, further observations. Am J Obstet Gynec 1965; 87: 814–26.
- Bui Min Ziep, Taratukhin E. Possibility of the Heart Rate Variability analysis. Russian Journal of Cardiology № 6/2011.
- Jelena Kornej, Christin S. Börschel, Emelia J. Benjamin, Renate B. Schnabel Epidemiology of Atrial Fibrillation in the 21ts Century. 2020